Analyze automation performance in MyLINK MarketingPlatform
Use Automation performance to review autoresponders, triggers, flows, and A/B-Testing results.
Before you start
You need:
- Access to Statistics
- An audience
- At least one autoresponder, trigger, flow, or A/B-Testing campaign with activity
Analyze automation performance
Step 1. Open Automation performance
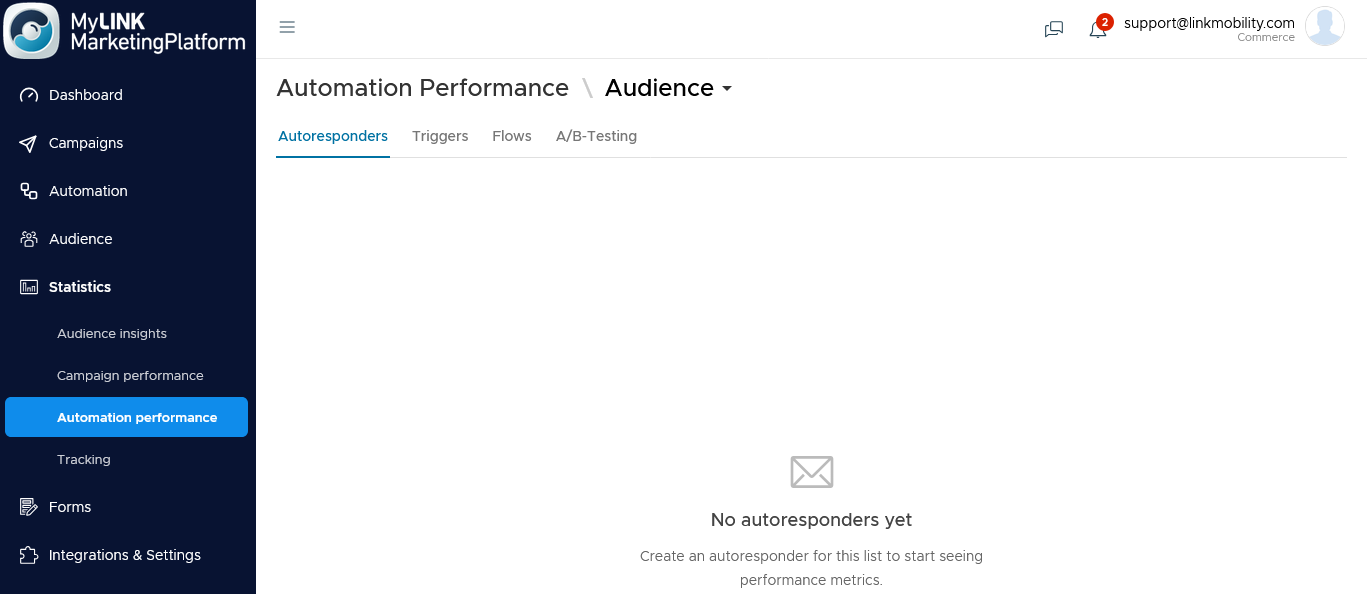
Go to Statistics and open Automation performance.
Step 2. Choose the audience
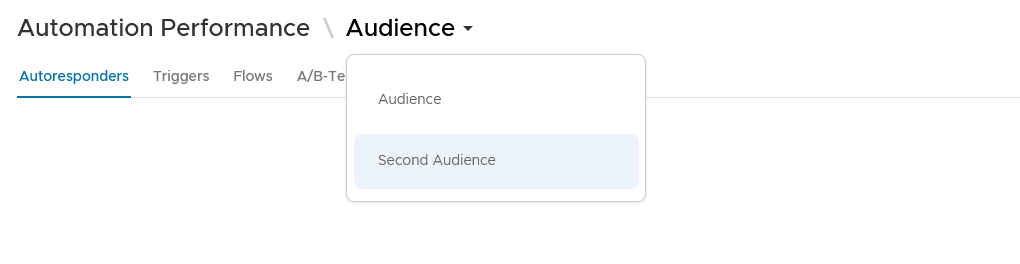
Select the audience you want to analyze.
Step 3. Open the Autoresponders tab
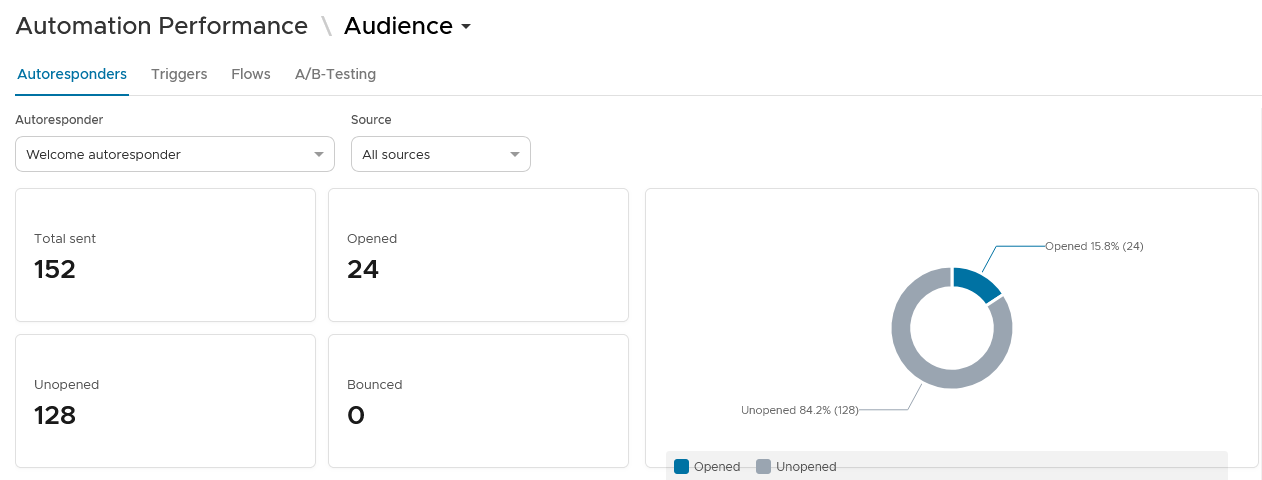
Choose an autoresponder to review sent, opened, unopened, and bounced totals.
Step 4. Open the Triggers tab
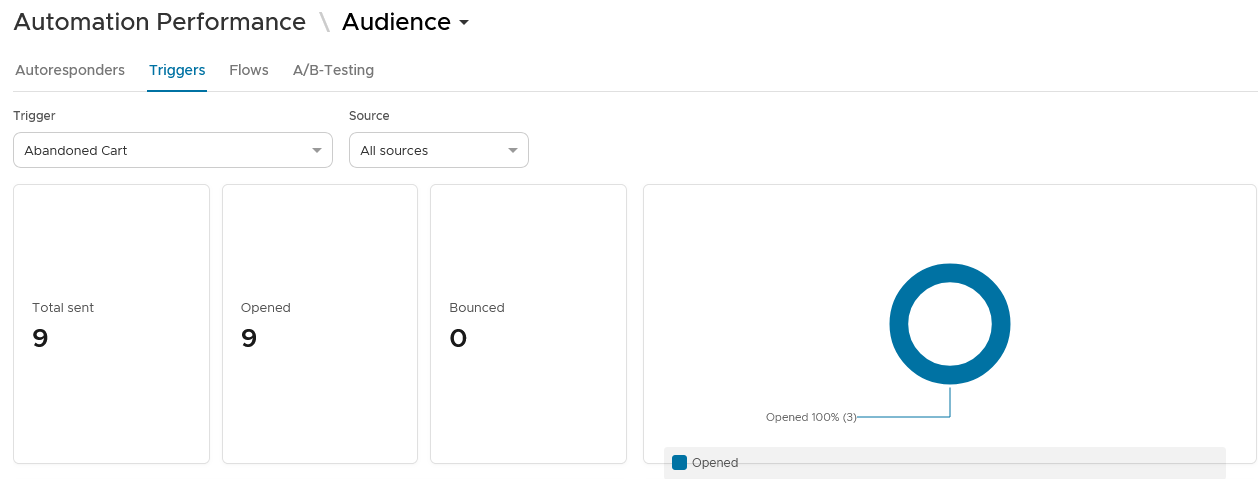
Choose a trigger to review sent, opened, and bounced totals.
Step 5. Open the Flows tab
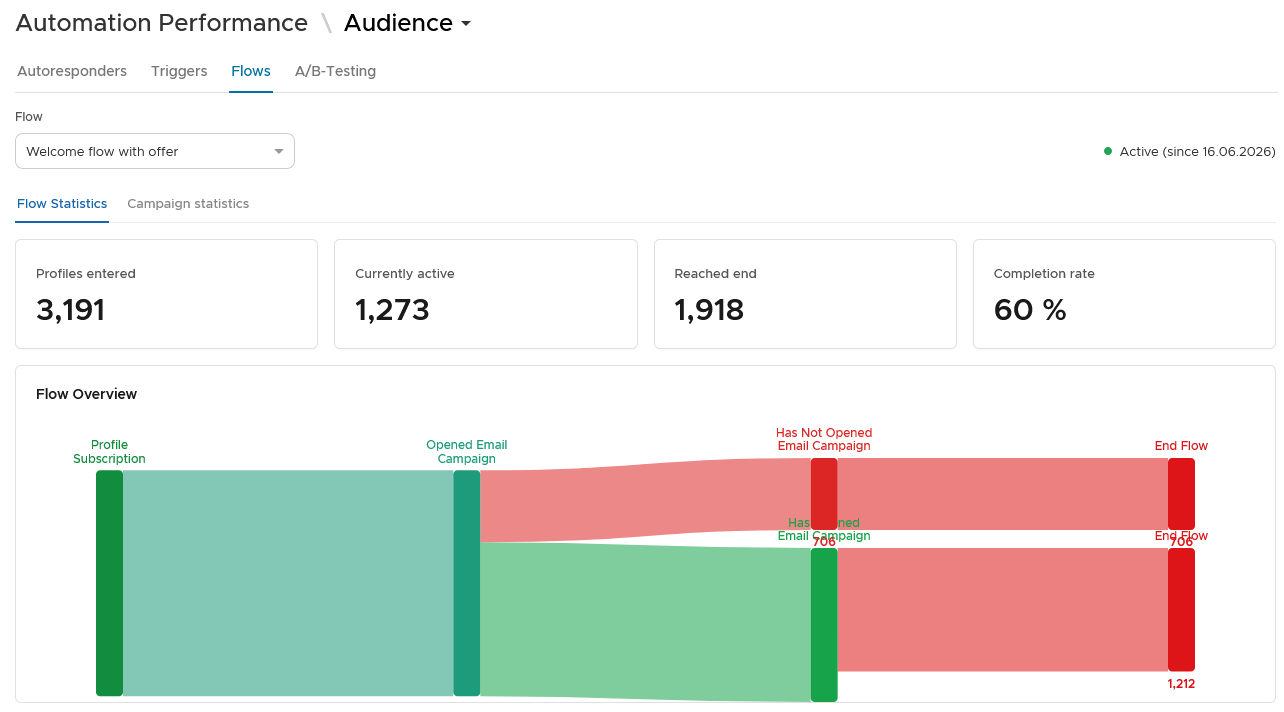
Choose a flow and version to review entered, currently active, reached the end, and completion rate.
Step 6. Review campaigns inside the flow
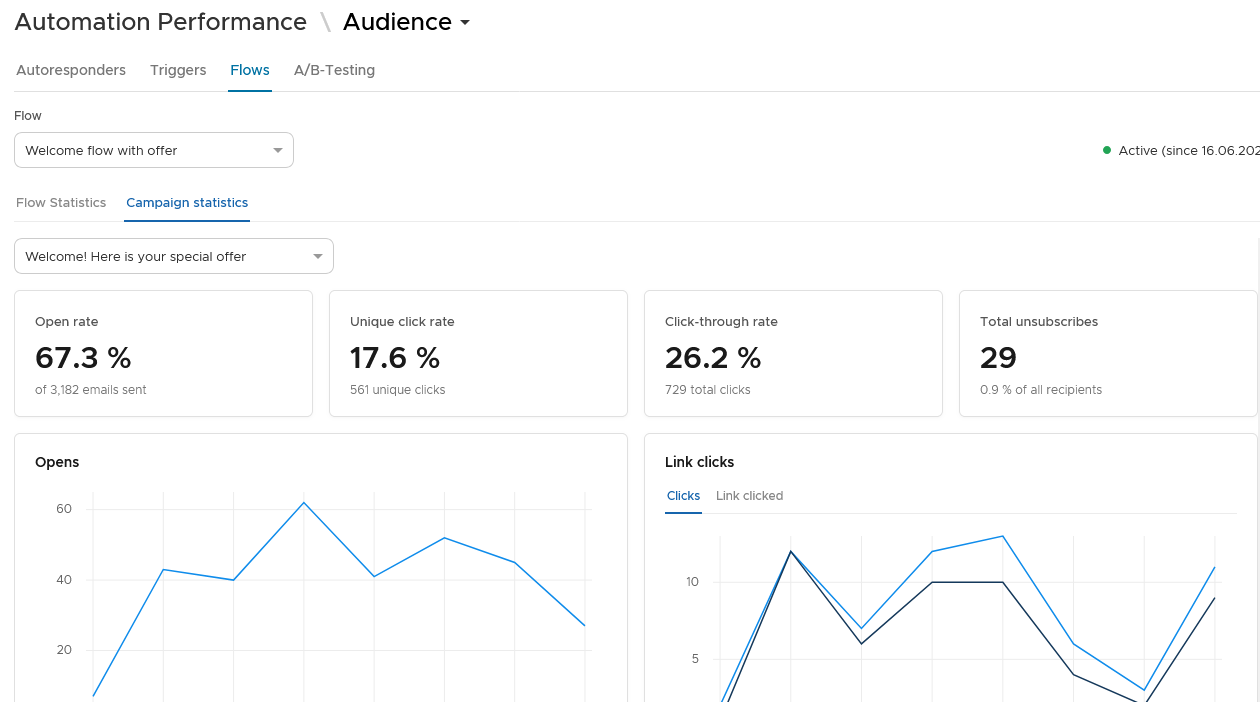
Open the second tab for campaigns sent within the flow.
Step 7. Open the A/B-Testing tab
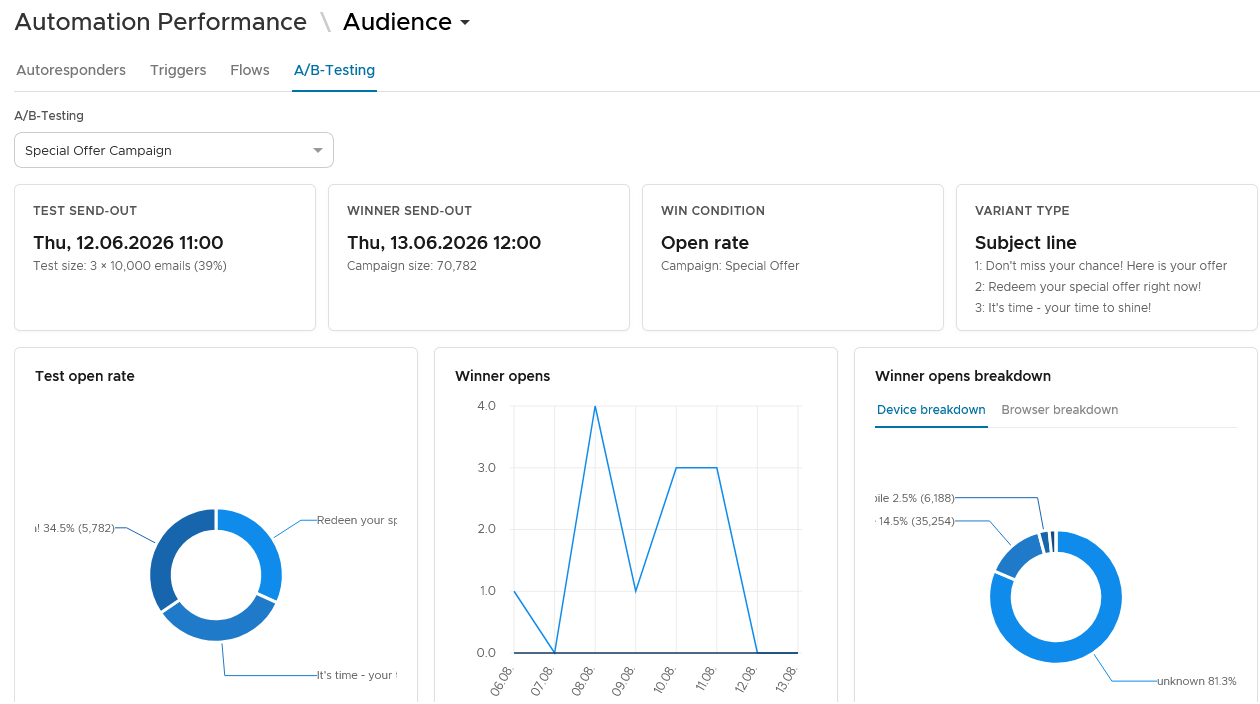
Compare the performance of each variation in a test.
When to use this feature
Use Automation performance when you need to check whether automated journeys are working as planned.
Common use cases
- Welcome autoresponders
Check how a welcome autoresponder performs. - Date-based triggers
Review results from a date-based trigger. - Flows and tests
Find where profiles leave a flow or compare A/B-Testing variations.
Marketing tip
Review flow completion rate before changing messages. If many profiles stop at one step, the issue may be timing, branching, or eligibility.
Additional information
Autoresponder reports
Autoresponder reports include sent, opened, unopened, bounced, a status donut, and open or click breakdowns over time and by device.
Trigger reports
Trigger reports include sent, opened, bounced, and engagement details.
Flow reports
Flow reports include a flow diagram that shows how profiles move through each step.
Things to know
- Choose the audience before reviewing automation results.
- Flow performance uses both a flow and version.
- Flow reports include a second tab for campaigns sent within the flow.
- A/B-Testing results compare each variation.
Troubleshooting
| Problem | Possible cause | Solution |
|---|---|---|
| No automation appears | The wrong audience may be selected | Choose the correct audience |
| Flow numbers look wrong | The wrong flow version may be selected | Check the selected flow and version |
| Campaign details are not visible | You may still be on the flow diagram tab | Open the campaign tab inside the flow report |
| A/B-Testing results are missing | There may be no test activity | Review the A/B-Testing campaign activity |